Crashes can be tricky to solve and basic information like the stack trace and app view are not always enough to figure out the cause of a crash. Fortunately, Instabug’s crash reports offer a wealth of information that will help you quickly identify and fix the problem.In this post, we will go through all the data Instabug includes with crash reports and how they can help you.
When you open a crash from the crashes list on your dashboard, you will be greeted with the crash report page. Here you can find all the details of this crash across occurrences.
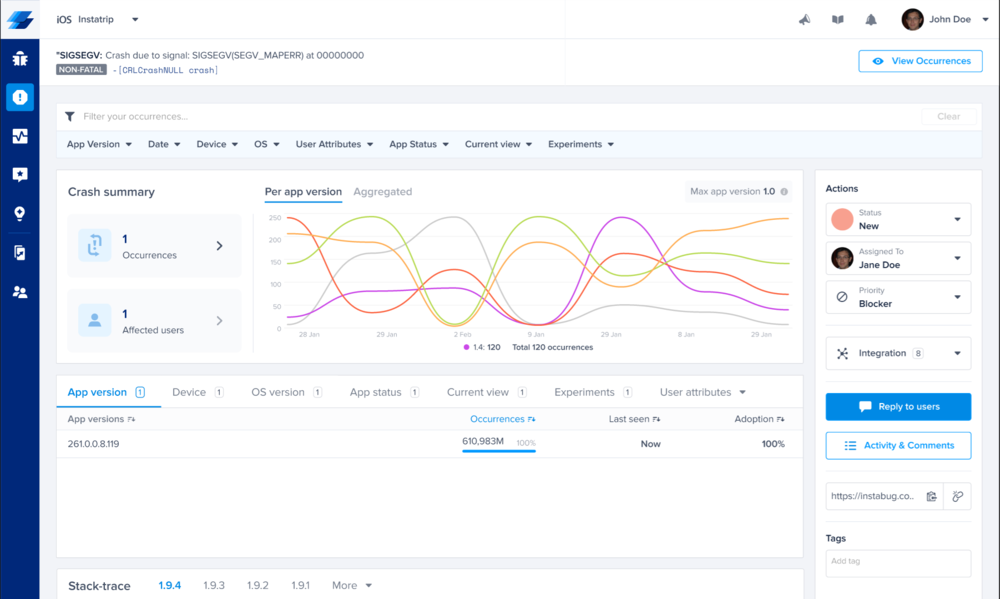
The crash page consists of:
Title banner

This contains the exception name followed by the app frame that caused the crash and serves as the name of the crash. The banner also includes a ‘view occurrences’ button that allows you to view each instance of this crash (more on that later).
Filters

You can use Instabug's extensive filters to view the data for a subset of a crash. You can filter your crash data by app version, date, device, OS, user attributes, app status, email, current view, and/or experiments.
Crash summary

This section gives you a quick overview of the crash details across occurrences. The details included are:
- Occurrences: Here you can see the total number of times this crash occurred across app versions.
- Affected users: This tells you how many unique users have faced this crash at least once.
- Occurrences graph: This graph plots the number of occurrences for this crash over time for each version of your app or all of your app versions on aggregate.
Crash details

In this section, you can view more details about the devices and environments the crash is occurring on. Here you can view the distribution of crash occurrences across app versions, devices, OS versions, app status, current views, experiments, and user attributes. This allows you to quickly spot environmental factors that could be causing the crash as well as understand exactly who it is affecting.
Stack trace
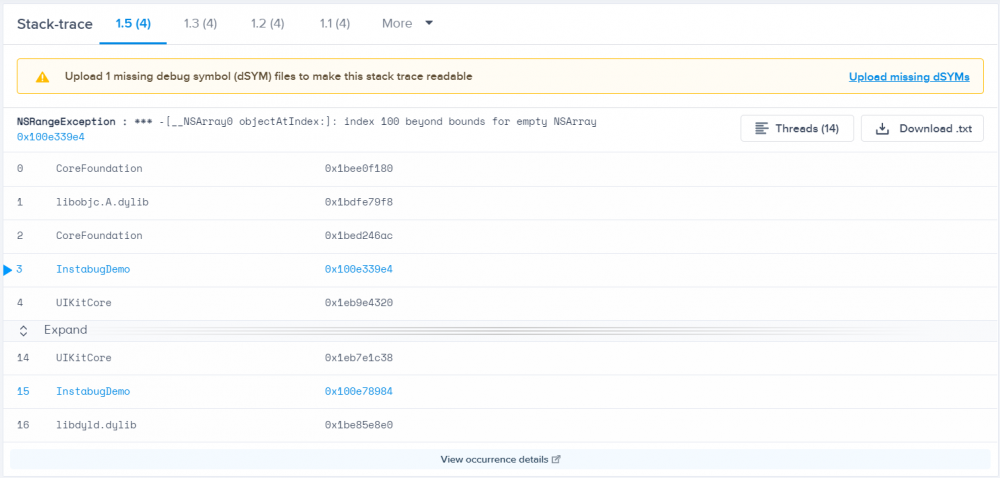
The next section contains the stack traces for the crash, with your app’s frames highlighted in blue. Instabug displays the first stack trace reported by each of you app versions for this crash. Here you can view the offending line of code as well as the app view the crash occurred on. However, please note that you need to symbolicate your crash in order for it to be readable.
Actions sidebar
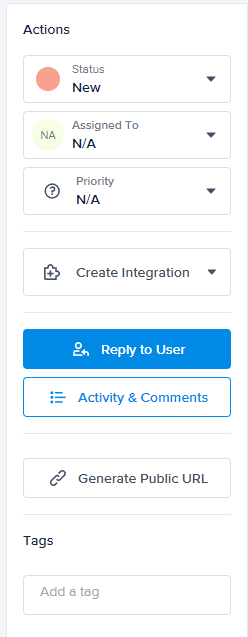
Finally, the actions sidebar is where you can change the crash’s status and priority, as well as assign it to a team member or forward it to one of your integrations. You can also reply to all the users that have faced this crash to let them know you’re on it. Additionally, you can view the crash’s comment and activity history, generate a public URL for sharing, and view or add tags to help you sort your crashes.
Occurrence report content
The information on the crash report page is great at giving you an overview and helping you understand the impact of a crash on your users, and which users it is affecting. With this information, you can understand which crashes have the highest impact and prioritize them. But to figure out the exact cause of a tricky crash, you need to dig deeper and view its individual occurrences.
Selecting the ‘view occurrences’ button in the title banner will take you to the occurrences page, where you can see a lot more information about individual instances of the crash.
The occurrences page consists of:
Filters
Here you can make use of Instabug's filters to view a subset of the crash's occurrences. Again, you can filter by app version, date, device, OS, user attributes, app status, email, current view, and/or experiments.
Occurrence details

In the occurrence details section, you can see all the device and environment details for the currently viewed instance of the crash. The details included are:
- Date and time of crash occurrence in UTC
- App version
- Device
- OS version
- App view
- Device location
- Session duration
- Locale
- Screen resolution
- Screen density
User attributes

The user attributes section displays any custom attributes you have created for your users and can help you identify which segment of your users is being affected.
Attachments

Here you can see any custom extra attachments if you have specified for any to be automatically collected with your reports.
Repro steps
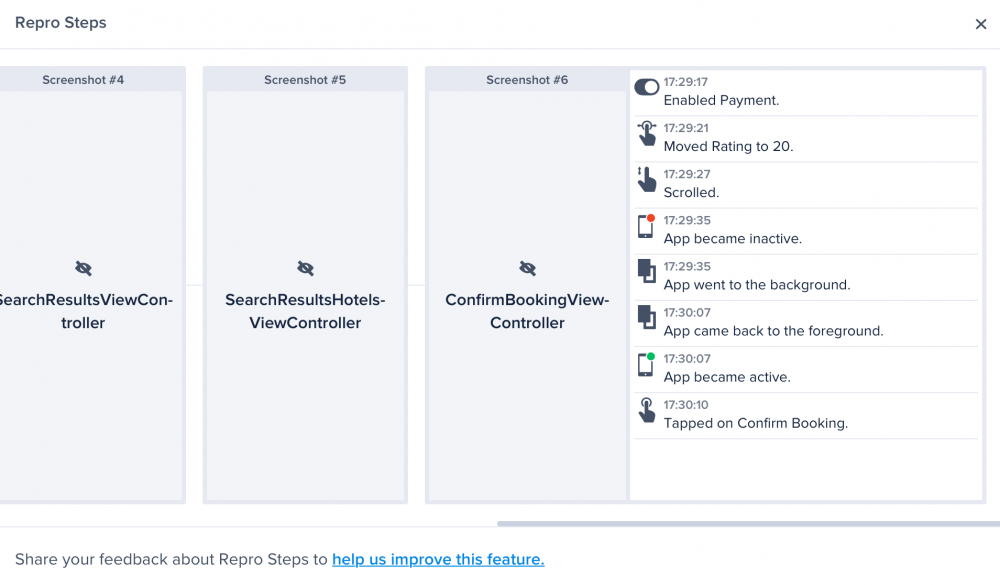
The next section is repro steps, which gives you a visual record of all your users' actions in each view before the crash occurred. This can help you find the exact steps you need to reproduce this issue and create a fix for it.
Session profiler

Some crashes only happen under specific conditions like high CPU load or memory consumption. Instabug's session profiler gives you a snapshot of the device environment for the 60 seconds leading up to the crash in the form of a graph. Hovering your cursor over any point of the graphs gives you more details about the state at that point, such as:
- CPU: This graph shows the CPU usage of your application. Hovering over the graph reveals the exact CPU load of the app, in percentage.Memory: This graph shows how much memory your application is using. Hovering over the graph reveals the memory used by your app's process over the total available memory for that process, as well as the exact usage percentage.
- Storage: This graph shows how much storage is available on the device. Hovering over the graph reveals the exact amount of used storage over the total amount of storage available, as well as the usage percentage.
- Connectivity: This graph shows the connectivity details of the device. Hovering over a graph reveals connectivity details such as WiFi name, cellular connectivity type (GPRS, Edge, 3G, LTE, or CDMA), carrier name, or "No connection" if there is no network connectivity.
- Battery: This graph shows the remaining battery available to the device. Hovering over the graph reveals the exact percentage of available battery power, as well as whether or not the device is plugged in.
- Orientation: This graph shows the application's orientation state; i.e. whether the application was in portrait or landscape mode. Hovering over the graph reveals the state at that point in time.
Logs
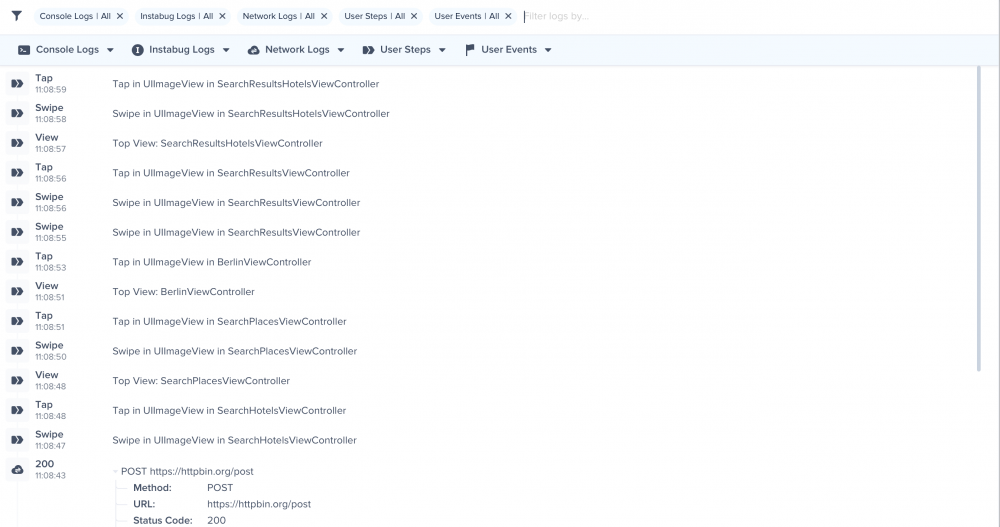
Last but not least is the logs section where you can view all the extensive logs Instabug can capture. You can use filters to view specific logs or even filter by specific events within these logs. Instabug captures the following logs:
- Console Logs: Default logs that are printed to the console when the application is running.
- Instabug Logs: Custom logs with different verbosity levels that you specify.
- User Steps: Every step the user has taken in the form of log entries.
- Network Logs: A log of every network request.
- User Events: A manual log of actions that a user has taken.
Crashes are an inevitable pain for app developers that consumes a lot of a developer's time and effort. Instabug arms you with all the information you need with every crash report, making detecting crashes and identifying their cause a quick and easy process.
Learn more:
- How to Get the Most Out of Instabug Crash Reports
- Benchmarking Crashing Sessions for Mobile Apps (What Is a Good Crash Rate?)
- Keep Users Loyal by Replying to Crash Reports
- Why Does Your App Keep Crashing?
Instabug empowers mobile teams to maintain industry-leading apps with mobile-focused, user-centric stability and performance monitoring.
Book a demo to see how Instabug can help your app


