

Contents
When we talk about Android app performance, the term "performance" can mean just about anything, but you hear it all the time. Anything and everything can be related to performance. In this specific case, let's about technical application performance monitoring. This is still a broad term when it comes to performance monitoring — should you be looking at CPU usage? Stability? UI speed? The quick answer is yes! You can monitor all of the above and more. But doing so isn’t as straightforward and requires tools to track and help make sense of all the performance data.
Before we get into details of the how and what to use for Android app performance monitoring let’s take a look at the different metrics that can be monitored.
- Stability
- App launch time
- UI screen transition speeds
- Network performance
- Logic execution speeds
- Battery consumption
- CPU usage
- Memory usage
The list can go on and on with different, increasingly specific metrics, but these cover the main technical Android performance monitoring metrics. The cost of poor performance cannot be understated. Here’s an example of some stats that highlight how critical app performance monitoring is (for more details, check out this post: How Much Your Mobile App Performance Costs Your Business):
- 36% of users will stop using an app due solely to heavy battery usage
- A whopping 53% of users uninstall or remove apps if they crash or do not respond
- 94% of users uninstall mobile apps after 30 days from download, and app crashes cause 71% of those uninstalls
But these metrics mean very little without some benchmarks or context to what would be considered good and bad performance.
Android performance monitoring benchmarks and how to meet them
App stability
App stability is measured in crashes per session or user. According to our data for 2025, the crash-free rates mobile teams should target are:
Crash-free users > 99 %
Crash-free sessions > 99.95 %
One of the best ways to both monitor and help improve your app’s stability is with a crash reporting tool.
.webp)
Instabug lets you know your crash-free rate and monitors crashes occurring in real-time. By catching upticks in crashes before they affect a majority of users, you can quickly adapt to many issues. Instabug’s crash reporting also gives you a detailed breakdown of why a particular crash is occurring, along with a complete stack trace to resolve issues.
App launch times
App launch speed is very indicative of the overall quality of your app and sets the user’s first impression. Based on an analysis of the top 100 apps, 39 apps start in under or around 2 seconds, and 73 in under 3 seconds. Ideally, you should be targeting an app launch time of 1.5 to 2 seconds.

With Instabug App Performance Monitoring, you can set your own threshold for the app launch time you’re trying to achieve. And based on that, you can see if it’s poor, average, or good and easily determine if slow launches are related to app versions, devices, or OS versions.
Network response times
Network calls play a huge role in the speed and responsiveness of your app. Studies show that to be competitive, your app should respond to user requests within 1 second. It also indicates that many apps fail to meet that due to unreliable or slow services.

Because Instabug’s SDK is built with Android devices in mind, you can track the full round trip of your network requests as seen on the client-side and be alerted to timeouts and issues. Most APM tools will settle for tracking server-side, but this won't give you the full picture. And for even more control and visibility, with Instabug APM you can also track custom URL patterns.
App trace completion times
To best understand your end-user experience, you need to be able to assess your client-side logic and see how long specific traces in your app take to execute (2 seconds on average).
To help tackle these issues, Instabug’s performance monitoring lets you define custom execution traces to track, and you can set target thresholds for your traces.

UI response times
Users can experience UI hangs for various reasons. If there’s a longer than usual delay (250ms on average) or a failure to respond to a user’s input, it’s considered a UI hang.

You need to be aware of UI hangs in order to fix them as soon as possible before the negative reports and comments come flooding in. Instabug APM gives you a detailed distribution of UI hang occurrences per screen to help you easily identify where your app’s UI is unresponsive.
Apdex score
The Apdex score is an industry standard that combines all these different metrics to give you a quick tell-all score that highlights your app’s overall performance as perceived by users. And it makes it much easier to align the team around one KPI and communicate it to all stakeholders.
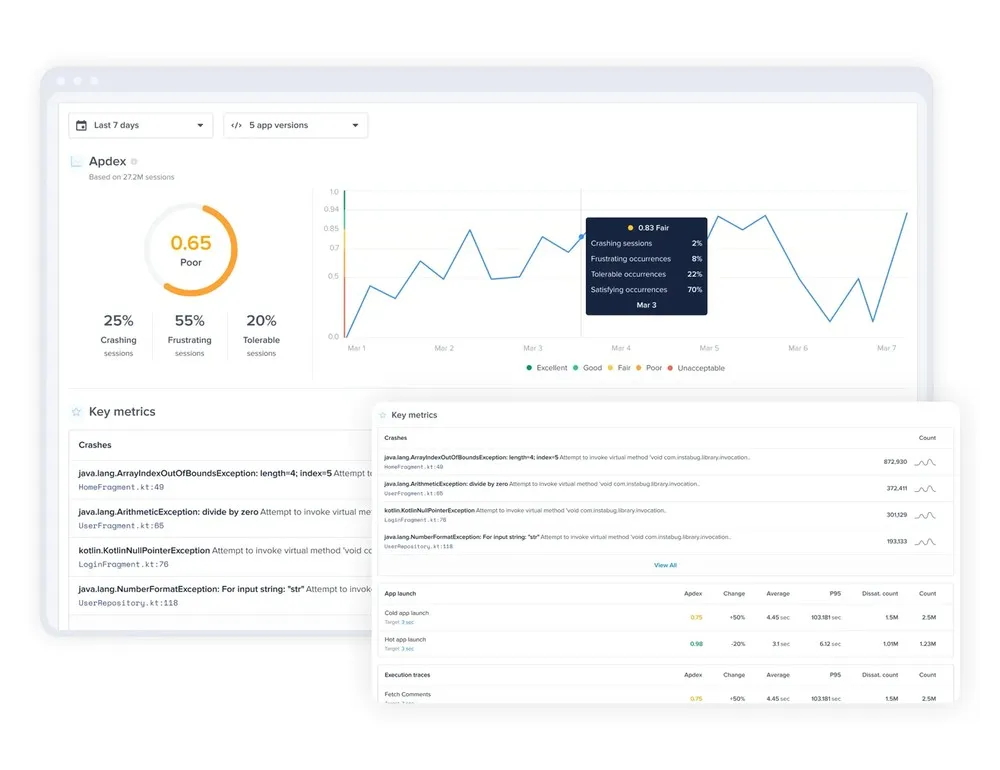
Instabug’s app Apdex score tells you whether your app’s overall user experience is unacceptable, poor, fair, good, or excellent, and you can track it over time and across versions. For more granular analysis, you can also see individual Apdex scores for app launch, specific app traces, and specific network requests.
Instabug APM helps you take a proactive approach towards improving quality instead of waiting for a crash or error to occur or hearing negative feedback from users. You’ll be able to identify possible bottleneck situations and keep your app running as fast as possible. By staying on top of monitoring, you can allocate and adjust resources to keep your app performing to the best of its capabilities.
Want to try our latest AI features?
Sign up to the closed beta now
Oops! Something went wrong while submitting the form.
Learn more:
- What is Mobile Application Performance Monitoring?
- App Performance Metrics and KPIs
- Stop Treating Mobile Apps Like Web Apps
- Harnessing Mobile-Led Growth: The Case for Mobile App Performance
Instabug empowers mobile teams to maintain industry-leading apps with mobile-focused, user-centric stability and performance monitoring.
Visit our sandbox or book a demo to see how Instabug can help your app


