

Contents
Our latest Application Performance Monitoring updates have made diagnosing and debugging issues much faster and easier. We've added a feature that automatically highlights potential issues for you, client- and server-side network failure rates to your network page, a more informative cold app launch stage breakdown for iOS, and an apdex rate of change column.
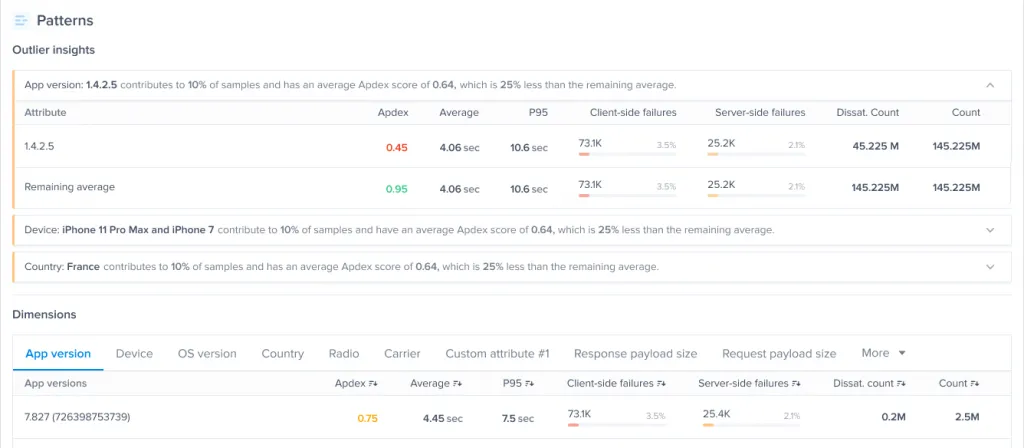
You are probably already familiar with the Patterns table on your APM pages, which gives you performance statistics for various dimensions and helps you look for patterns in your data. Noticing patterns can help you understand and isolate specific performance issues.
Now, instead of searching for patterns manually or potentially missing out on small details, pattern identification is already done for you. At the top of your Patterns section, there is a new Outlier Insights box. Instabug APM will detect and highlight deviations from patterns, which you’ll see in Outlier Insights. When a specific dimension stands out and contributes to a significant number of samples, the details will be shown there. You’ll also see figures for the remaining averages for quick comparison.

A cold app launch can sometimes take some time to execute, and reducing that time is a common performance priority. Now it’s easier for iOS developers to achieve that with a new breakdown of iOS cold app launch stages. Your Cold App Launch page now shows you a granular breakdown of the stages of the cold app launch and how long each is taking. You can now identify particularly slow stages in your app launch and focus on those.

Network failures are some of the worst-case scenarios in app performance, so they’re now easier to monitor with Instabug. There’s a new column on your Network Performance page called Network Failures. You can click to display failures in descending order to help you prioritize critical issues. Hovering over the column will display more information about occurrences of both client and server-side failures. If you see a failure, just click on the item in the list for more details, and start debugging. Understanding the type of failure you’re experiencing will help you to choose the appropriate solution.

Now, in addition to seeing your apdex score, you’ll also see how it’s changed since the last period. Is your app performance trending better or worse? Knowing the rate of change will help you assess your performance. To see how your apdex score has changed overall, you can click on the row to see a graph with more details.
Want to try our latest AI features?
Sign up to the closed beta now
Oops! Something went wrong while submitting the form.
Learn more:
- How to Improve Mobile App Performance
- Mobile App Performance Metrics and KPIs
- Introducing Instabug App Performance Monitoring (APM)
- Mobile App Quality: An Essential Guide
Instabug empowers mobile teams to maintain industry-leading apps with mobile-focused, user-centric stability and performance monitoring.
Visit our sandbox or book a demo to see how Instabug can help your app


