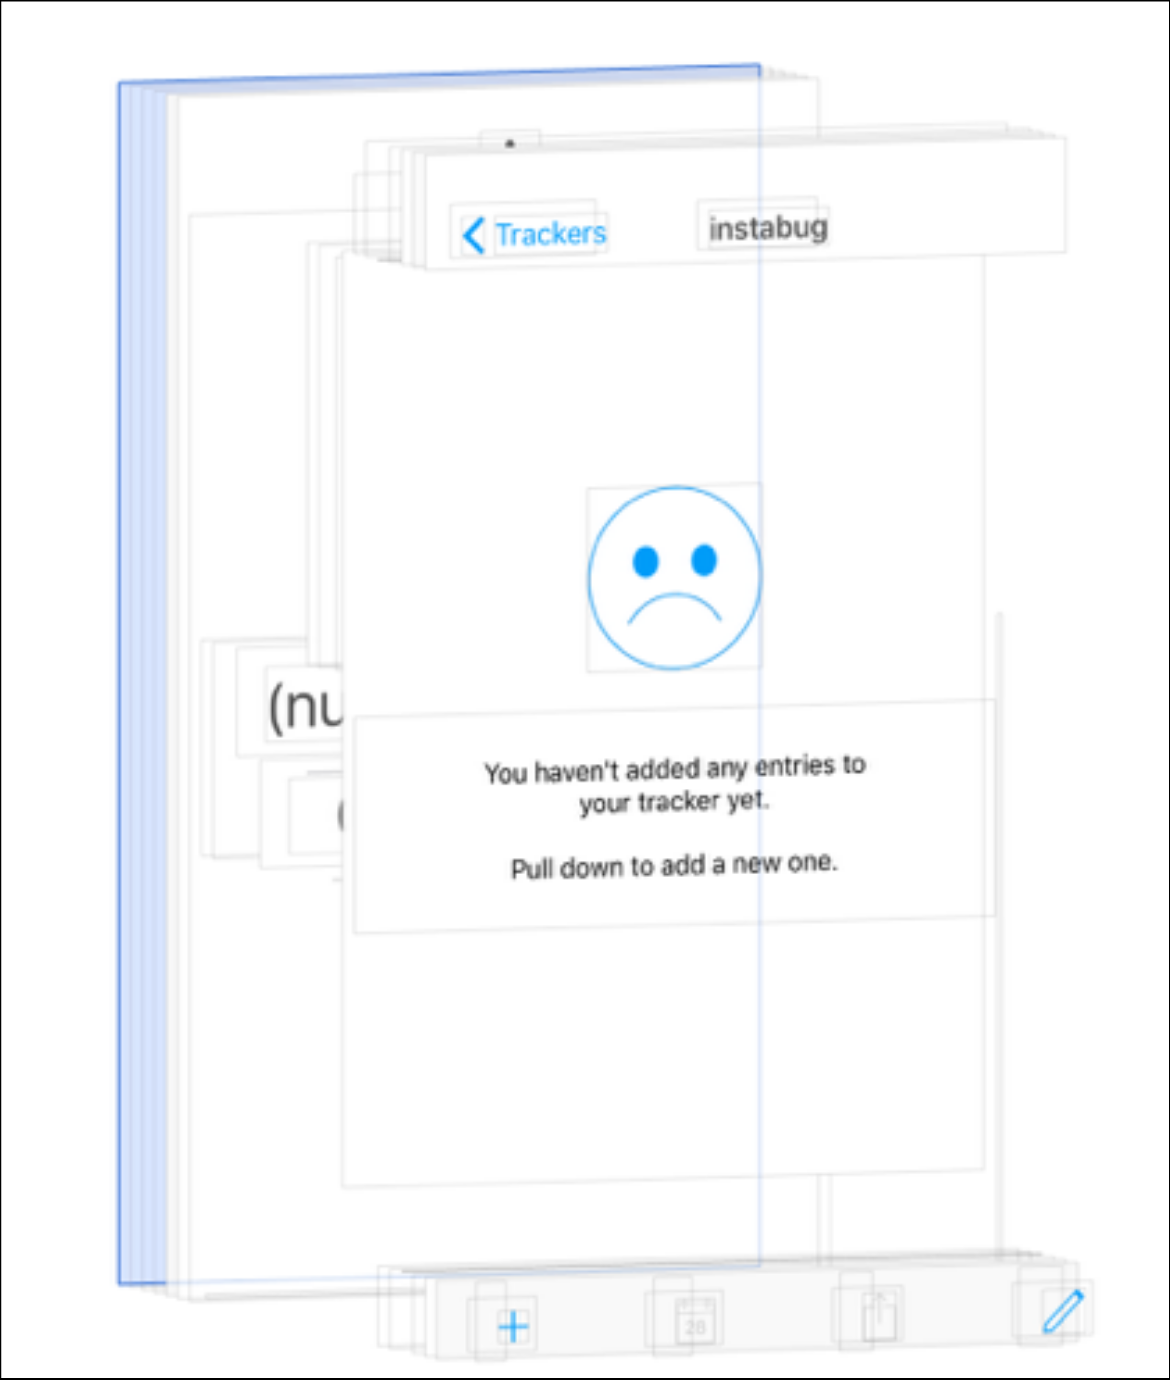
Before we implemented our current View Hierarchy feature, we were only able to tell our users whether or not a defect existed in their UI, but we couldn't show them where or why, and we couldn't offer a solution.
View Hierarchy's 3D layers became the solution. With this feature, developers can see the UI elements of separate app views and inspect each layer with its respective properties.Motivated by the limitations of a single screenshot and inspired by Xcode's View Hierarchy tool, we decided to implement this elegant visualization feature, which went into production in our February 2017 Instabug SDK release.
At first, we thought it would be easy -- just iterate through all UIViews in all UIWindows, store some information about these views, capture screenshots, and recreate in the dashboard. Turns out, it wasn't so straightforward.
Challenge: visible frame calculation

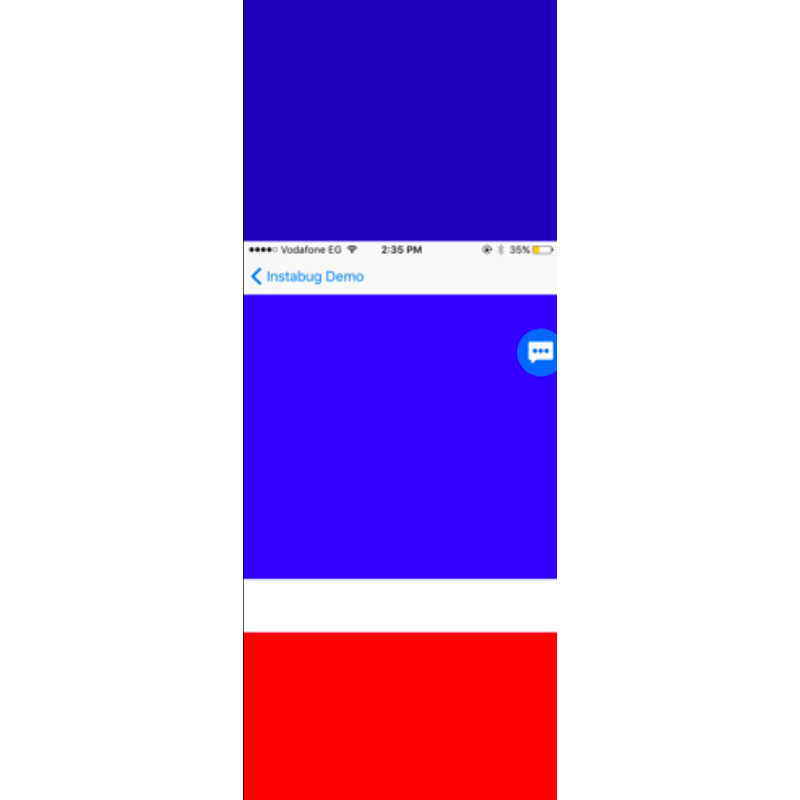
The red and dark blue areas are outside of the visible frame. The first challenge was calculating the visible frame of the UIView in order to capture and display it correctly in the Instabug dashboard. We started with this:
(NSRect)convertRect:(NSRect)rect toView:(NSView *)view;
But after this failed to deliver the right frame for us in some cases, we realized that we couldn't just map the UIView frame to window bounds. Again, not so straightforward.Sometimes, we found that the mapped frame was inside the UIWindow bounds, but the superview frame was outside the UIWindow bounds. While the UIWindow remained in an absolute position, the superview shifted relative to it.
Our solution
The app views essentially form a chain, so we figured out that we had to get each visible frame by recursively capturing the intersections between the superview and the subview frame.
But this didn't work all the time, thanks to clipsToBounds. If clipsToBounds = true for the UIView, we capture the intersection. If not, we capture only the UIView frame because the intersection will be visible outside its superview.The second exception to the intersection method is UIScrollView. We modified Apple's API and in cases with a scroll view, we calculate the visible frame like this:
CGRectMake(scrollView.contentOffset.x,scrollView.contentOffset.y,scrollView.ibg_originalFrame.size.width,scrollView.ibg_originalFrame.size.height);
Challenge: frozen activity indicator

The next big challenge was capturing such a large number of screenshots, around 70. Taking a screenshot of each view in the app takes time, and since we can't access UI elements from a background thread, we have to capture the screenshots in the main thread. These factors caused performance issues.
At first, we took all the screenshots at once and put it in an array. But capturing the screenshots in the main thread meant that when we were taking the screenshots, the UI was totally frozen and we couldn't display an activity indicator. So how could we capture around 70 views without taking a lot of time or blocking the UI?
Our solution
We leveraged data structure by using linked lists, with one node pointing to the next node instead of one container holding everything. This gives the UI a chance to update itself between nodes.
Each node captures a UIView screenshot and the screenshot of the next node is captured in a dispatch_async on the main queue. Since tasks begin and finish executing in the order in which they are received on the main queue, the asynchronous execution of each node leaves a gap in between one node pointing to the next, which gives the activity indicator time to load in between each task (capturing a single screenshot).
Learn more:
- How We Migrated Our Front-End While Scaling at Instabug
- How We Migrated Our Massive Crashes Database
- Why We Automated Our Front-End Testing at Instabug
- Mobile App Testing Vs. Mobile SDK Testing: What is the Difference?
Instabug empowers mobile teams to maintain industry-leading apps with mobile-focused, user-centric stability and performance monitoring.
Visit our sandbox or book a demo to see how Instabug can help your app


