

Contents
Users are paying more attention to how your app is performing. Simply put, higher app quality outperforms low app quality. And the best way to go about improving your app’s performance and general quality is through application performance monitoring. Dedicated tools allow you to easily identify performance issues such as slow screen transitions, crashes, or network issues before they are problematic to the user. So let's talk about mobile APM best practices.
This article will go through what you need to know to use an application performance monitoring tool to help you get the most out of the tool.
Apdex score
Apdex (Application Performance Index) is an open standard for measuring the performance of software applications in computing. The idea behind it is to have a universal score that represents the overall user experience with an app.
Apdex scores range between 0 and 1. The higher the value, the closer you are to a satisfying user experience:
- ≥ 0.94 means your app’s performance is Excellent
- ≥ 0.85 and < 0.94 means your app’s performance is Good
- ≥ 0.7 and < 0.85 means your app’s performance is Fair
- ≥ 0.5 and < 0.7 means your app’s performance is Poor
- < 0.5 means your app’s performance is Unacceptable
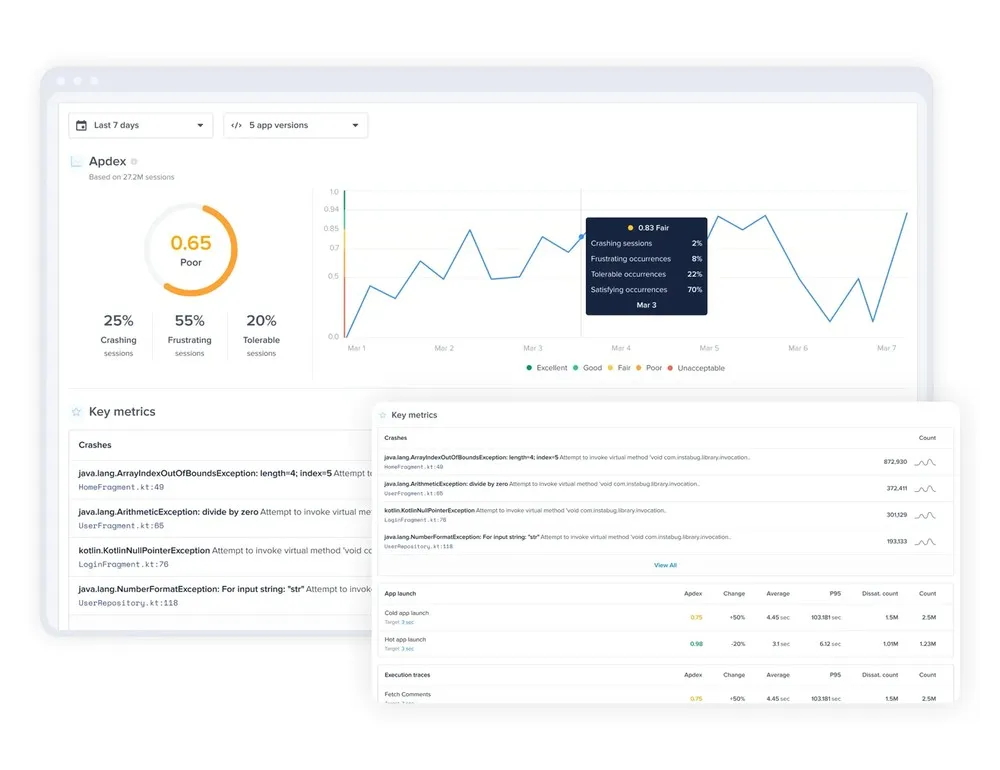
Your overall Apdex score is a combination of the Apdex of individual metrics like crashes, app launches, app traces, network calls, and UI hangs. The best way to make the most out of your Apdex score is to align your team around a specific score target.
Monitor new releases
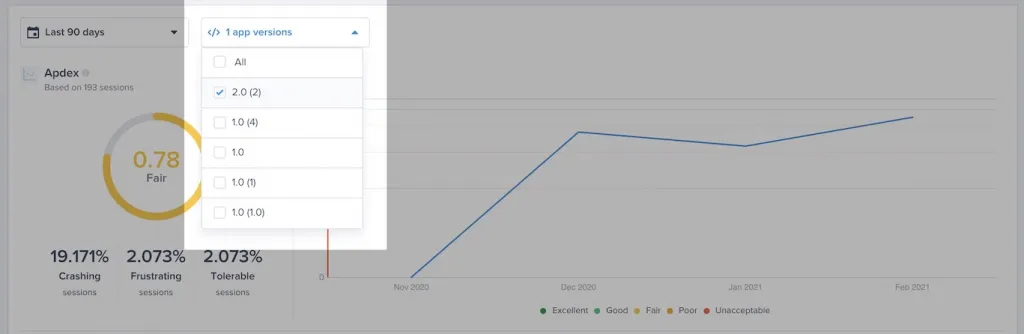
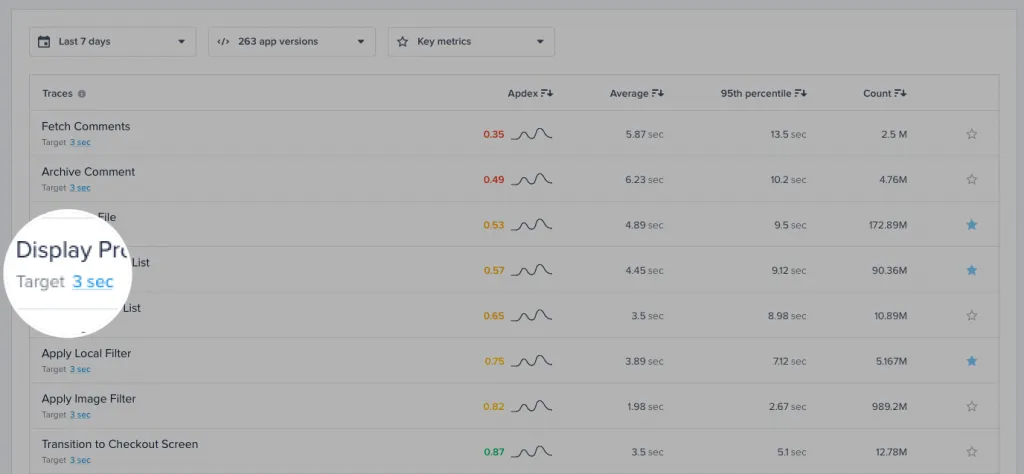
Normally any significant change in your app's performance and by extension its apdex score will be as a result of a new release. Rolling out code changes, new features, or even simply releasing fixes can all result in changes to your app's performance. Instabug APM lets you easily filter and monitor by app version and help you stay on top of new releases. And by having a set Apdex score target you can make sure that each new release is meeting expectations and not affecting user experience.
From your dashboard and main app apdex page, make sure you select your latest or any specific app version as highlighted in the screenshot below.
Mobile APM key metrics
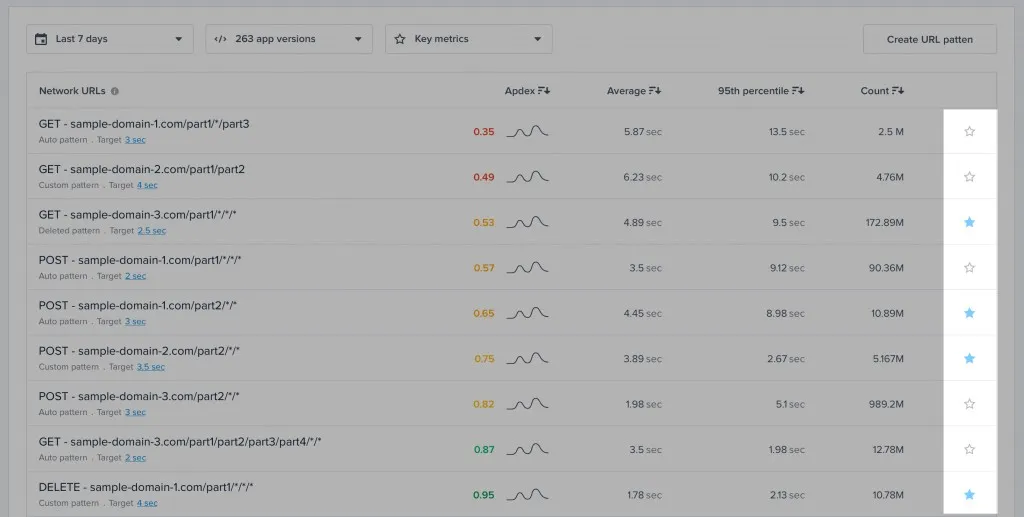
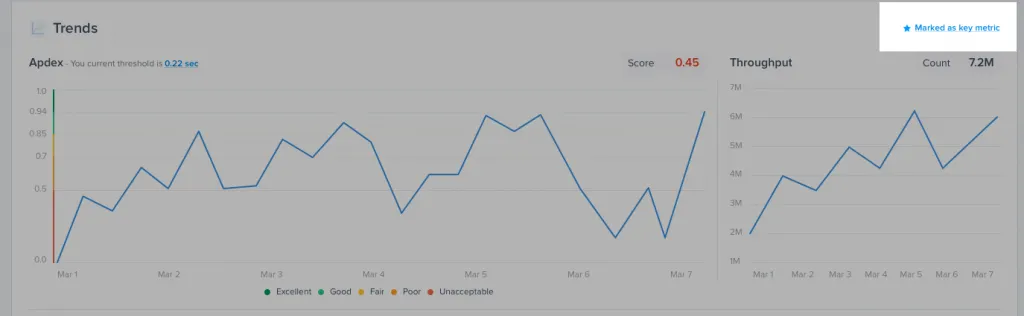
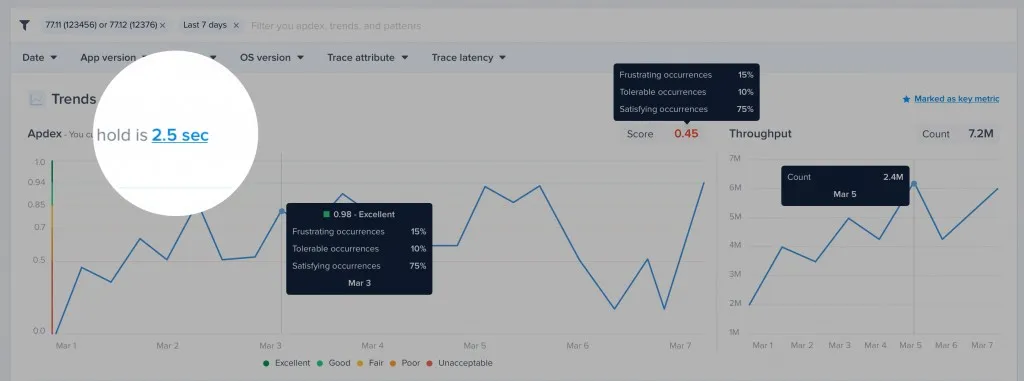
Instabug APM lets you get the most out of the Apdex score by giving you control over which metrics to include in your app’s overall Apdex score.
By default, all app launches, app traces, network URL patterns, and UI traces are marked as key metrics and included in your overall score. But sometimes these metrics might not be reflecting the end-user experience or for any reason need to be disabled. You can easily customize which metrics to include in the overall apdex score by marking and unmarking key metrics.
From your APM dashboard simply go to the metric that you wish to unmark or mark and click on the star as shown in the screenshots below.
UI Hangs
Users have been conditioned to expect quick and accessible experiences, and if they face UI hangs, it can cause them to abandon your app and hurt their impression of your brand. UI hangs are assessed by comparing your app’s delay in responding to a user input to the total amount of time they spend on a certain screen.
Diagnose faster with filters
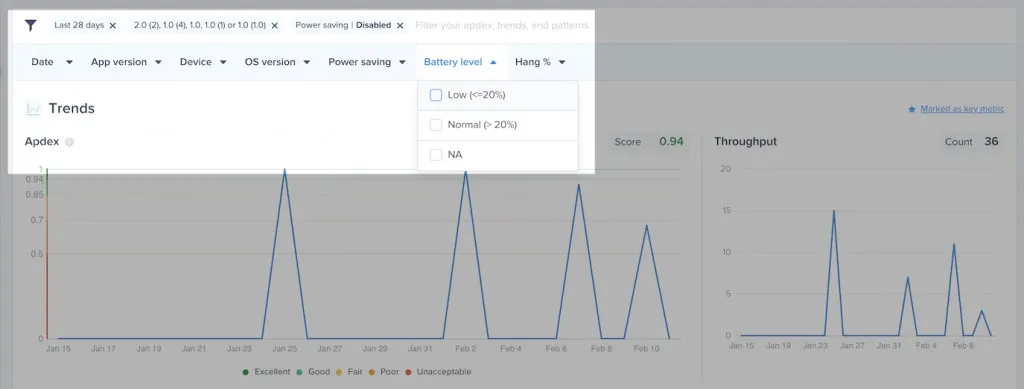
Instabug APM shows you a detailed distribution of UI hang occurrences per screen to help you easily identify where your app’s UI is unresponsive. While UI hangs can be the result of many different factors, the best way to go about diagnosing the issue is to check the common causes.
Similar to the app apdex score, changes to your app are likely to result in unforeseen issues and UI hangs. When starting to diagnose it's best to filter by app release. Making sure that a specific release (generally the latest one) is not behind the issue is the first step.
Another very common cause of UI hangs is if specific devices go into battery-saving mode or if they have very low battery levels. Most devices automatically prioritize other functions in this case and result in a much slower app experience. From the UI hangs page you can filter according to whether battery saving mode is enabled or if the device is running on low battery. This will help you quickly eliminate obvious causes for UI hangs that are unrelated to your app.
Custom UI hang
The majority of traces are detected automatically, but to get the most out of UI hangs, Instabug gives you full control over adding custom UI traces.
You can create your own groups with custom names by leveraging the relevant start and stop APIs.
You should note that:
- You can run only one custom UI trace at a given time; a trace must be ended before a new one can be started.
- The SDK will end any occurrence that wasn't explicitly ended via the end API.
Depending on your development platform check out the specific API call:
App launch
First impressions are important and this fact isn't any different for mobile apps. App launch times can make or break your app in the eyes of users. If your app takes too long to open up they will move on to other apps. Monitoring your app launch time and making sure it's meeting user expectations is made simple with Instabug APM.
App launch activities
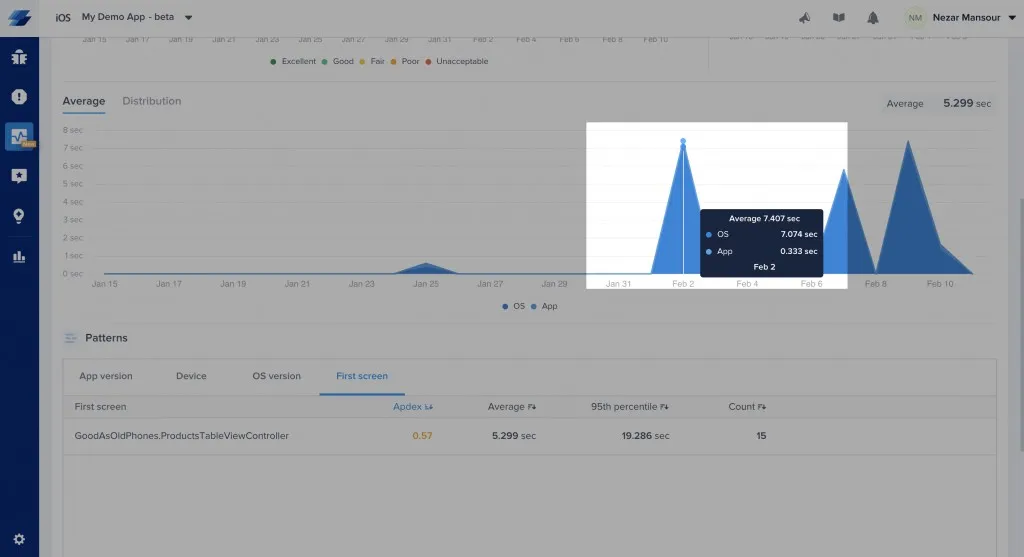
Similar to other metrics eliminating the obvious causes behind poor app launch times can help diagnose a vast majority of issues. Specific to app launch the graphical distribution of slow launches differentiates between launch states to help you diagnose at a glance. By hovering over an occurrence you can see the app launch activity distribution and tell where the delay occurred. A common issue is the OS causing a delay in the launch and the app launch itself not being the culprit as shown in the screenshot below.
Detect and diagnose outliers
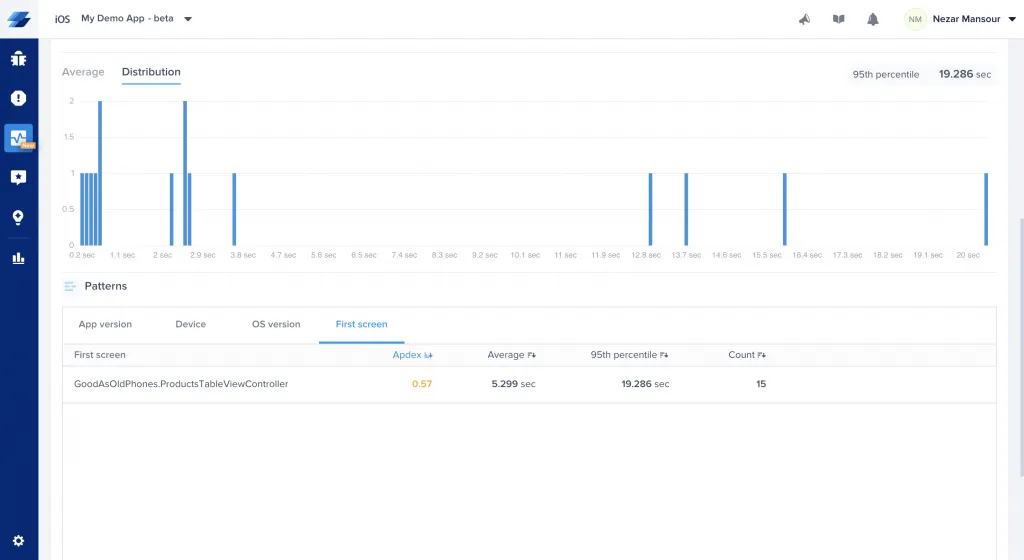
You can also detect anomalies and specific issues using the 95th percentile distribution graph. And then using filters you can isolate and diagnose specific instances using the app launch latency filter. This can be very helpful in resolving specific issues like a certain device having slow launch times for example.
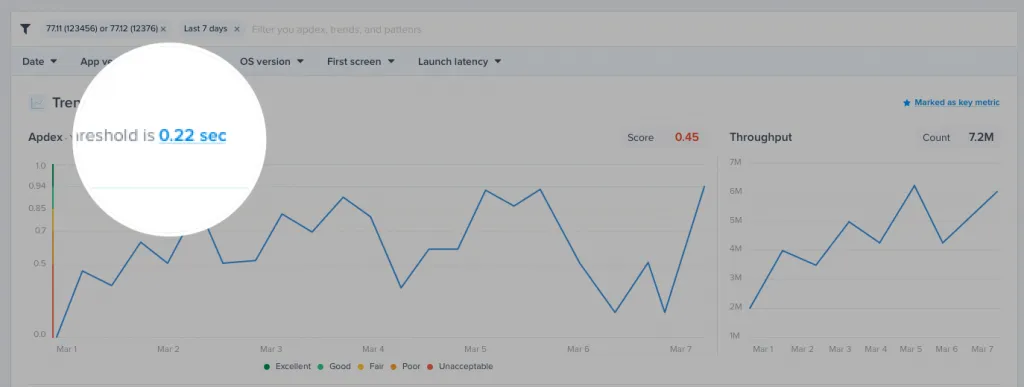
Customizing latency thresholds
By default, the app launch target is set to 2 seconds, however, you can easily change this number from your dashboard by clicking on the action highlighted in the screenshot below.
Execution traces
UI performance isn’t the only thing that needs monitoring. Instabug APM lets you define custom execution traces that monitor the latency of custom logic in your code.
It is similar to defining a custom UI trace. Just call an API to start tracking and make another call to stop tracking when the task is over.
Instabug automatically aggregates the data of occurrences that are sharing the same trace name. You should note that:
- You can run several traces with different names in parallel.
- You can run several occurrences of the same trace (same trace name) in parallel.
- The SDK ignores any trace occurrence that doesn't end. For example, if you start a trace then the user kills the app before it reaches the relevant end statement, this occurrence is ignored to avoid skewing your numbers.
Depending on your development platform check out the specific API call:
Adding trace attributes
Instabug automatically augments any trace with some attributes like app version, os version, and device. You can leverage those attributes on your dashboard to segment, drill down, and find insightful patterns. For example, you can easily spot if a performance problem is related to a specific device model.
You can use the API below to add your custom attributes to a trace. For example, if you are A/B testing, you can add an experiment attribute.
While setting a new attribute to a trace that you have already created, you pass the attribute's key and value:
- The attribute's key can be up to 30 characters.
- The attribute's value can be up to 60 characters.
- You can add up to 5 unique custom attributes to each trace.
- The attribute's key can't be an empty string or null.
- The attribute's value can't be an empty string.
- You can call the API twice with the same key to override a previous value.
- Setting the attribute's value as null clears and removes the attribute.
Execution traces
By default, the target is set to 2 seconds, however, you can easily change this number from your dashboard by clicking on the action highlighted in the screenshots below.
Network issues
URL patterns
Instabug APM uses URL patterns to group similar network call occurrences in order to aggregate their numbers. There are different components to URL patterns and Instabug detects them automatically. However, you can also create your own custom URL patterns to have even more control. Check our guide on how to do this for iOS and Android.
Diagnose and detect common network issues
Similar to the other metrics Instabug APM tracks there are specific elements to network performance that can help you quickly diagnose and detect issues.
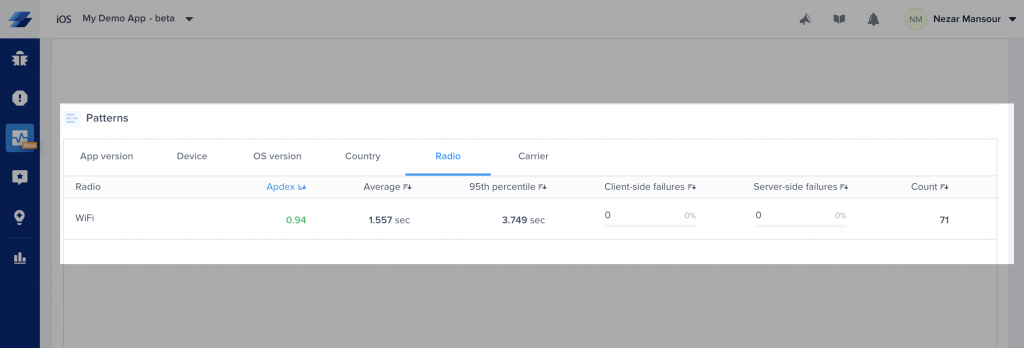
There are a couple of common issues that result in network issues from the client-side. If a user is using an unreliable cellular network or a carrier with constant issues it can easily be detected by filtering as shown in the screenshot below.

Get more details with client-side failures
Normally any APM tool will be able to highlight network failures from the server-side. But Instabug APM takes it a step further by also highlighting whether the network failure was from the client-side. This helps you determine at a glance whether the issue should be assigned to the backend team or mobile team.
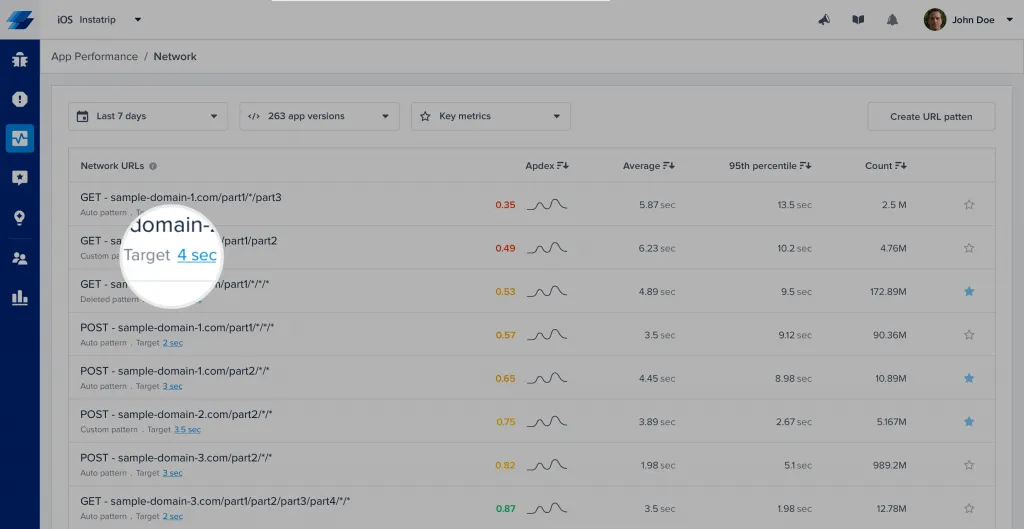
Customize network failure threshold
By default, it is set to 2 seconds. However, you can easily change this number from your dashboard by clicking on the action highlighted in the screenshot below.
Instabug APM
A mobile APM tool will alert you about things like slow screen transitions, slow network calls, and UI hangs that also negatively impact your end users' experience. Following mobile APM best practices will give you clear signals about your app's quality and user experience. With an APM tool like Instabug's, you can take a proactive approach to discover and fix performance issues in your application before these problems become bug reports.
The best way to use APM is not to work backward and fix issues that arise late; ideally, you'll be working forwards to constantly monitor and continuously improve your app's performance.
Want to try our latest AI features?
Sign up to the closed beta now
Oops! Something went wrong while submitting the form.
Learn more:
- APM KPIs: Mobile App Performance Monitoring Metrics and Targets
- Understanding Cold, Hot, and Warm App Launch Time
- App Launch Optimization: How to Resolve Slow Startup Times
- Mobile App Network Performance Monitoring and Debugging Guide
Instabug empowers mobile teams to maintain industry-leading apps with mobile-focused, user-centric stability and performance monitoring.
Visit our sandbox or book a demo to see how Instabug can help your app


