When an app crashes, a crash report containing the app conditions leading up to the crash is generated. With Instabug’s Crash Reporting, you can have detailed crash reports sent to your dashboard instantly. Each Instabug crash report captures a detailed snapshot of the running environment, the different threads’ states, the steps to reproduce the crash, the network request logs, and more.
Each Instabug report includes all stack trace information on all running threads. The most important frames in the stack trace are highlighted, and these highlighted frames are your app's frames. In order for these crashes to be readable, symbolication is required.
What is symbolication?
In a crash report, stack traces are sent with only memory addresses resembling the included frames. Compiling a release build for your app will strip the debug symbols to reduce the size of the generated binary. Symbolication is the process of transforming these stack traces' active memory addresses into something human-readable in terms of methods and functions.
How to symbolicate crashes
In order to symbolicate your crashes, you need to upload a reference for the debug symbols that got stripped. This reference is called a Debug Symbol file (dSYM). These debug symbols will attribute the unreadable memory addresses to their function and method names.
How to download dSYM files
Using iTunes Connect
To download the dSYM files for your app, do the following:
- Log in to Apple iTunes Connect.
- Select My Apps > (Your App) > Activity.
- From the list of builds for your application, select the build number you need for the dSYM.
- Select Download dSYM.
How to upload dSYM files to Instabug
Each app build you compile has a UUID, which your dSYM file will be attributed to. To find your project's dSYM, run the following command on your Instabug dashboard.
After locating your project’s dSYM, you can then upload it manually or automatically.
Manually
In order to upload your dSYM file to Instabug’s dashboard, you need to find it. If your app build has Bitcode enabled, you will need to download dSYMs first from Xcode.
To upload dSYMs for Bitcode-enabled apps, follow these steps:
- In Xcode, select Window, then Organizer.
- Under the Archives tab, select an archive with the app version you need to symbolicate crashes from.
- Click the Download dSYMs... button. Xcode will insert the .dSYM files into the selected archive.
- View the archive by right-clicking on it in Xcode and selecting Show in Finder.
- Right-click on the archive and select Show Package Contents, then open the dSYMs directory.
- Compress all the .dSYM files you find in that directory and upload the archive to the Instabug dashboard.
If you’re not using Bitcode, you will need to find the dSYM files on the machine you used to build the app. Make sure that the dSYM gets generated during building in order to proceed. You can check the Debug Information Format build setting in Xcode where this is controlled.
Now that you have the location of the dSYM, you will find the actual dSYM file inside a Contents/Resources/DWARF subdirectory.
Now that you have the dSYM file:
- Compress the dSYM file you have located on your machine into a zip file.
- Go to Upload dSYMs in the Settings menu of your Instabug dashboard.
- Upload the compressed file.
Automatically
Instead of uploading it manually, Instabug has a shell script that can automatically upload your project's dSYM during the build process. Go to your project's Build Phases tab and add a new Run Script Build Phase, to use it. Add the following to it.
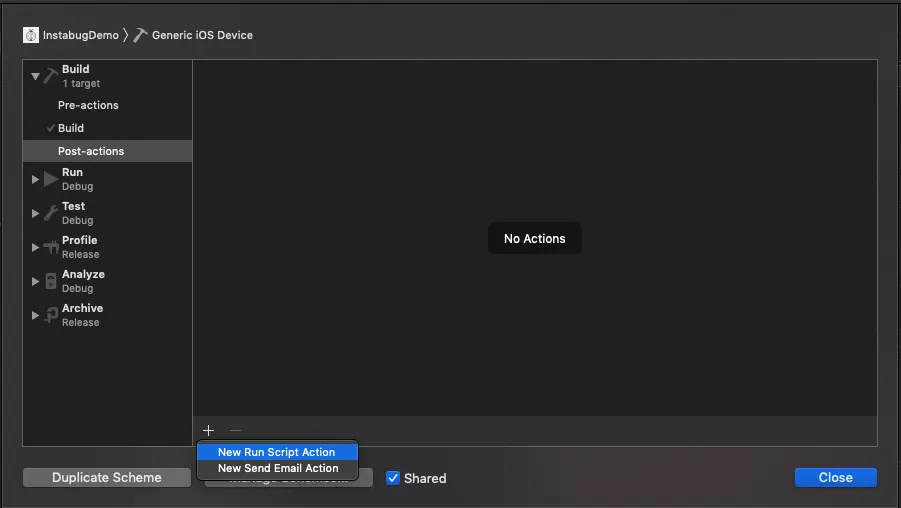
And if you're using Xcode 10, you will need to add the previous script to the Archive > Post-actions.

Symbolicated crashes
Now that your crash reports have been symbolicated you can view stack traces in a human-readable format. Stack traces will highlight the most important frames and methods involved in the resulting crash. With the full details provided in Instabug’s crash reports along with more granular crash occurrence filtering, you can easily diagnose what went wrong.
Learn more:
- How to Get the Most Out of Instabug Crash Reports
- Benchmarking Crashing Sessions for Mobile Apps (What Is a Good Crash Rate?)
- Keep Users Loyal by Replying to Crash Reports
- Why Does Your App Keep Crashing?
Instabug empowers mobile teams to maintain industry-leading apps with mobile-focused, user-centric stability and performance monitoring.
Visit our sandbox or book a demo to see how Instabug can help your app


